
Why Load Test Numbers Lie
By Andrew
The report says the platform handled 10,000 virtual users at an average response time of 240 milliseconds. Nothing in it is red. Six weeks later the same platform buckles under a quarter of that traffic, and everyone stares at the same PDF wondering which part of it was false.
Probably none of it. The numbers were measured correctly by a tool doing exactly what it was told. The problem is that load testing carries at least four structural measurement biases, they are all well documented, some of them for two decades — and every one of them points the same way. Toward optimism.
The generator stops asking when your system slows down
Most load tools model users as threads. A virtual user sends a request, waits for the response, thinks for a moment, sends the next one. That is a closed workload model: new arrivals are triggered by completions. Real internet traffic is open — people arrive because they arrive, entirely indifferent to whether your checkout endpoint is currently taking eleven seconds.
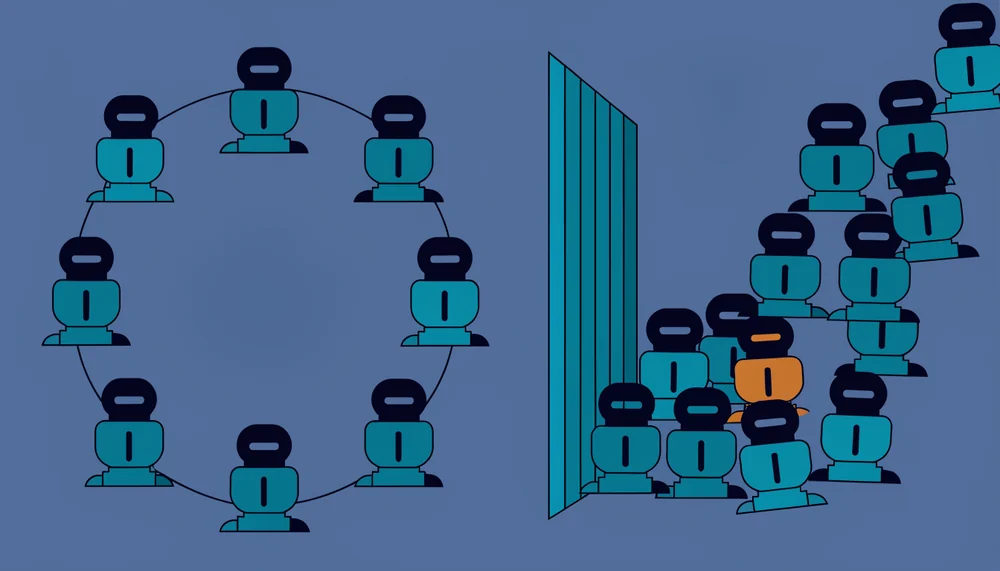
The difference is not academic. In a 2006 study from Carnegie Mellon, Bianca Schroeder, Adam Wierman and Mor Harchol-Balter ran both models against real implementations at identical load with identical service demands. Mean response time under the open model “can exceed that for a closed system model by an order of magnitude or more.”
Read that again with your last capacity report in mind. Same traffic volume, same work per request, ten times the latency — purely from how arrivals were generated.
The instinct is to compensate by adding virtual users. It does not work. The same paper found a significant gap between the two models “even for an MPL of 1000” — a thousand concurrent simulated users still behaved like a closed system, because the defining property was never the count. It is the feedback loop. When your system stalls, a closed generator politely stalls with it, and the queue that would have formed in production never forms on the stand.
There is a nastier corollary. The researchers found that size-based scheduling beat first-come-first-served by more than a factor of ten in the open model, while in the closed model there was “little difference” between policies. An optimization can look worthless on your test rig and be the single thing standing between you and an outage.
Modern tools know this. k6 exposes open and closed models, constant request rate and fixed iterations as explicit choices. The question is whether whoever wrote your test script made that choice deliberately, or inherited a default.
The stopwatch conspires with the system
The second bias lives inside the measurement itself, and it has a name: coordinated omission, coined by Gil Tene.
Picture a generator instructed to send one request every 100 milliseconds. It sends one. The system stalls for three seconds. The generator is blocked waiting, so it does not send the thirty requests it owed during that window. When the response finally arrives it records one slow sample and resumes.
Thirty requests that would have queued behind the stall were never issued, so their latencies do not exist anywhere in your dataset. The measurement apparatus quietly synchronized itself with the failure it was supposed to observe. It is the survey that estimates train delays by interviewing only passengers who boarded.
This is why Tene wrote wrk2, a fork whose entire premise is holding a constant request rate regardless of how the target behaves, and why HdrHistogram takes an expected-interval argument so it can reconstruct the samples a stalled generator failed to take. Whole benchmarking suites — YCSB, Cassandra’s stress tool — have been patched for this years after publishing numbers people believed.
If your report does not say how latency was recorded, its percentiles are decorative.
One slow server, and most of your users feel it
The third bias is about arithmetic that nearly everyone gets wrong in the same direction.

Jeff Dean and Luiz André Barroso laid it out in The Tail at Scale. Take a server that typically answers in 10 milliseconds but has a 99th-percentile latency of one second. Handle a user request on one such server and one request in a hundred is slow — tolerable. Now fan that request out across 100 servers in parallel and wait for all of them: “63% of user requests will take more than one second.”
Not one percent. Sixty-three. And it gets worse as systems get wider: a service built on 2,000 such machines, where only one request in 10,000 exceeds a second at the individual level, still sees “almost one in five user requests taking more than one second.”
The sources they name are mundane — contention for shared resources, background daemons, queueing, garbage collection pauses, energy management. None of it is a bug anyone would file. It is simply what a busy machine does, and it is the raw material from which user-visible slowness gets manufactured once you multiply it by fan-out.
Which makes the average response time on the cover of your report close to meaningless, and even a per-service 99th percentile only a component. What a user experiences is the maximum across everything their page touched.
The rig is not the system
The fourth category is less elegant, because it is a list rather than a principle. Each item is individually defensible and they compound.
Caches you accidentally warmed. A script that hammers the same fifty product pages produces a cache hit ratio no real Tuesday will ever reproduce. You measured your cache, not your application.
Datasets that fit in memory. Two hundred test accounts behave nothing like four million rows once the query planner changes its mind about an index.
The dependencies you stubbed. Payment providers, identity services, third-party APIs — they get mocked because mocking is sensible and their rate limits are real. It also means the component most likely to fail first under load is the one component you did not test.
Connection reuse. A generator that opens a pool of connections and keeps them alive skips the TLS handshakes that thousands of arriving mobile clients would each pay for.
A single region. Load from one datacenter with 2-millisecond round trip time tells you nothing about users on mobile networks three thousand kilometres away.
An environment sized “close enough.” Half the nodes, a smaller database tier, a different storage class — then results scaled linearly in a spreadsheet, which is precisely the assumption load testing exists to check.
What the operators with the most to lose concluded
Here is the part that should settle the argument. The organizations running the largest systems on earth largely stopped trusting synthetic load.
Facebook’s engineers built Kraken, described at OSDI in 2016, which tests capacity by shifting live user traffic into a datacenter until something bends. Their stated reason for not using a generator is blunt: existing systems use synthetic workloads, and “their synthetic workloads only cover very specific use cases.” After three years in production the results are quantified — load tests that used to stop at roughly 70% of theoretical capacity now routinely exceed 90%, worth “over 20%” in hardware utilization.
Twenty percent of a fleet that size was hiding in the gap between synthetic load and real load.
Netflix arrived somewhere similar with squeeze testing, steering production traffic at a canary in controlled increments to find where carrying capacity actually sits. LinkedIn built Redliner on the same principle.
None of this means your team should test in production. Most organizations lack the traffic volume, the isolation, or the rollback machinery to do it safely. The point is narrower and more useful: the people who could afford the most sophisticated synthetic load generation in the world looked at what it told them, compared it against reality, and went to considerable expense to stop relying on it.
Five questions worth asking before you believe a report
The tooling has improved enormously since LoadRunner shipped in 1993 and JMeter followed at the end of that decade. Gatling, Locust and k6 generate more load, from more places, with less ceremony. What none of them can do is prevent a well-run test from measuring the wrong thing.
So when the next report arrives, before anyone signs off on a capacity number:
- Open or closed model, and at what arrival rate? If nobody knows, it is closed, and your latencies are optimistic.
- How was latency recorded — could the generator fall behind? Constant-rate generation and coordinated-omission correction, or the percentiles do not mean what they appear to.
- What was the cache and dataset state? Cold-start and full-size, or the numbers describe a machine that has already seen every question you plan to ask it.
- Which dependencies were stubbed? Then ask what happens when that one is the bottleneck.
- Which percentile, measured where, across how many services? A 99th percentile per service is not a 99th percentile per user, and fan-out is what turns the second into the first.
A load test that survives those five questions is worth the money. One that does not is a document establishing that your infrastructure can serve a workload nobody will ever send it.
Choosing between tools and approaches is its own problem — we wrote up how we evaluate them in our load test systems case study, and it is a standing part of our QA outsourcing work.
- On August 17, 2026
- 0 Comment